Hey there!👋 It’s Elias. Let’s look at how to setup effective logging in Python for data pipelines, using decorators and Loguru.
After years of building data pipelines, from ones that lived in janky notebooks to ones that automate complex workflows in production environments, logging wasn’t something I paid a lot of attention to.
Maybe its because it wasn't that interesting and I was confident that my code was working. A simple import of the logging standard library and some Stack Overflow lines to set the formatting worked like a charm.
If anything went wrong in my code, I would usually have logged something at some point in a function. So I would always see that an error occurred, but sometimes it wasn't clear where it really failed as exceptions were hidden.
It only took one bad event for me to realise the importance of doing it right from the start.
Investing time in setting up robust logging not only saves us from headaches but also provides reusable, reliable tools for future projects.
Logging Fundamentals
For those of you new to logging, let’s start with the basics.
Logging is essential because it allows you to monitor the flow of your data pipeline. Without logs, you wouldn’t know if something went wrong unless you actively check for issues.
Proper logging provides valuable insights into your programs and reduces the time needed to debug problems.
In larger teams and codebases, the quality of logging becomes ever more important. It reduces the need to sift through the codebase to locate the point of failure, making it easier for everyone to understand and debug issues.
These are the common log levels you should know and a description of what they contain:
DEBUG: Detailed information that will be useful when debugging an error
INFO: Audit log of information about expected events
WARNING: Unexpected issue that may impact the running program
ERROR: Issue in the code has caused something to fail
Different log levels allow for effective categorisation and filtering of log messages, making it easier to configure alerts and monitor your systems.
For instance, you might log a warning when a pipeline fails to find one of the expected data sources but only stop the program and triggers an error alert if multiple sources are missing.
Or, if you’re running a data pipeline in an AWS Lambda function, you can filter your logs on Cloudwatch based on their levels, helping you pinpoint issues more efficiently.
Logging With Loguru
To take this up a notch, let’s explore how to set up logging in Python using Loguru, a popular third-party package that significantly improves the logging experience.
In an ideal world, our logs would provide a clear view of when each function call starts and ends, along with details like execution time and the parameters passed. This level of insight can be incredibly valuable for both monitoring and debugging when issues arise.
While it’s possible to manually insert these audit logs into every function, this approach leads to ugly repetitive code.
A more efficient solution is to implement a standardised logging mechanism that automatically generates audit logs for each function call. This way, you’ll capture essential information consistently, while any additional audit or diagnostic logging can be added directly within the function itself.
We can leverage Python decorators to perform this functionality - if you're not familiar, I recommend having a read of Real Python's great resource on decorators.
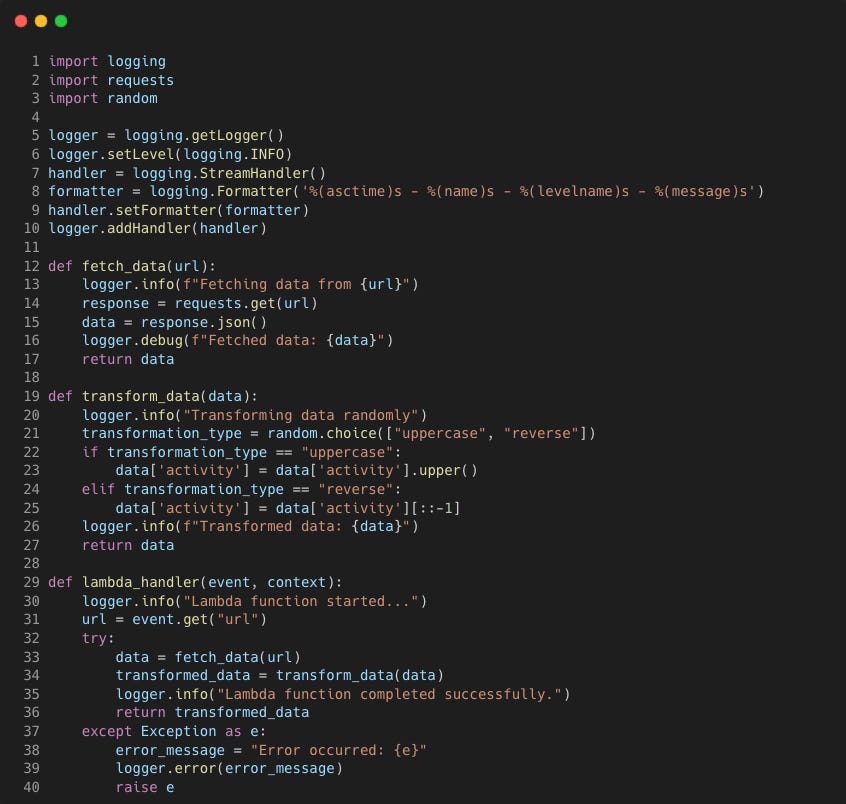
Take the following sample Lambda function that ingests some boring data, makes some boring transformations with some boring logging.
Running the lambda function locally with an event that has a URL, this is what the logs looks like
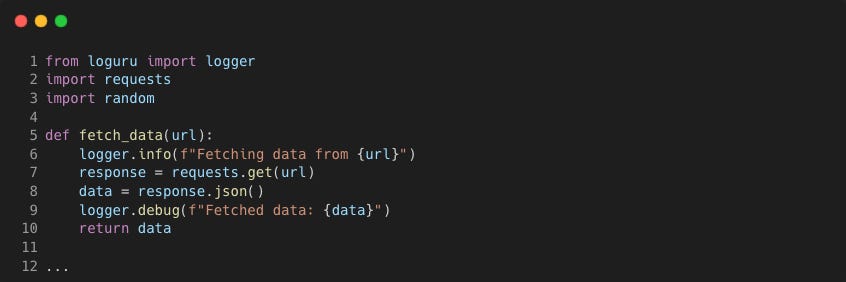
Although it works, one improvement would be to use Loguru instead of the standard library logging package. It works great 'out the box' for development with a logger already configured. We only need to change the import line and remove the logging configuration.
The logger is pre-configured with a default handler that adds colour for terminal outputs, line number and module information.
Customised Logging
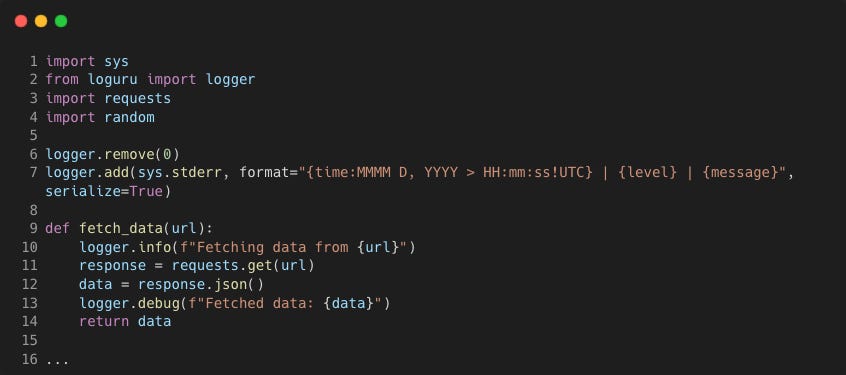
Loguru is highly customisable and next we'll see how we can have structured logging. This is is supported through the serialize option, allowing you to output your logs in JSON format.
We can also enhance the logs with extra contextual data by including additional fields in the JSON. This makes it simpler to filter by key-value pairs when viewing logs in AWS Cloudwatch, for example.
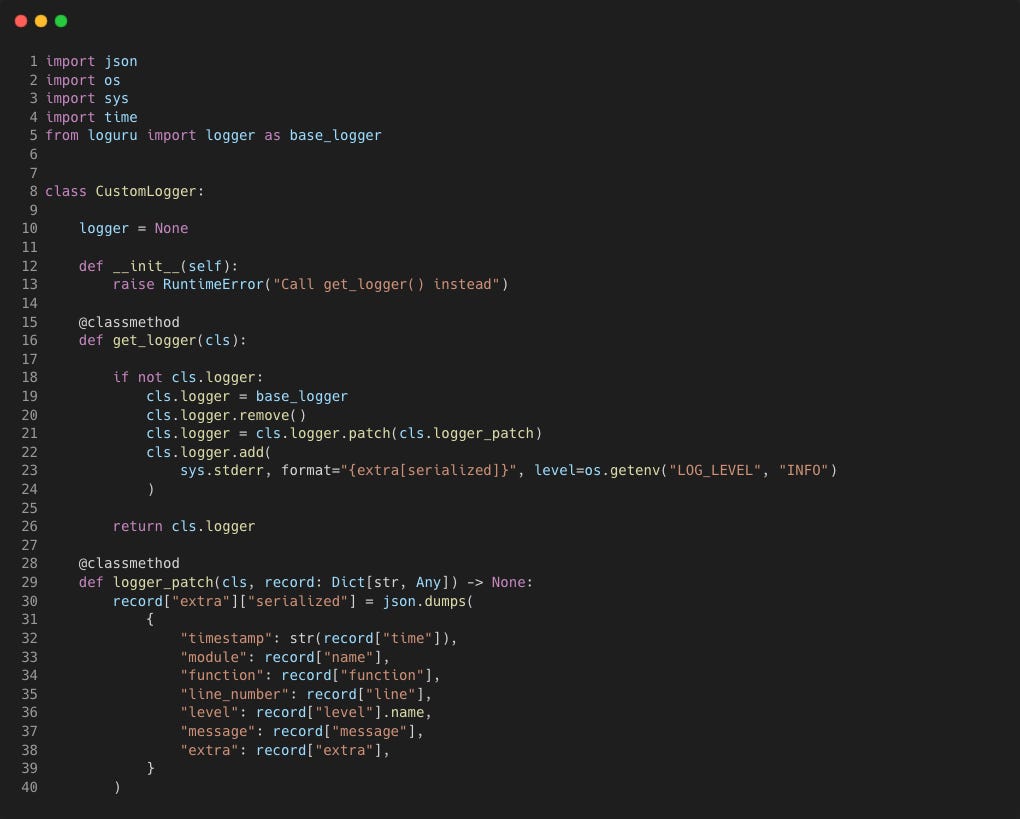
We can create our own logging handler by using the remove() method first to remove the default configuration for the default handler (ID 0). Then use the add() method to add a new handler to the logger.
After running the sample Lambda function again, this is what our log output now looks like
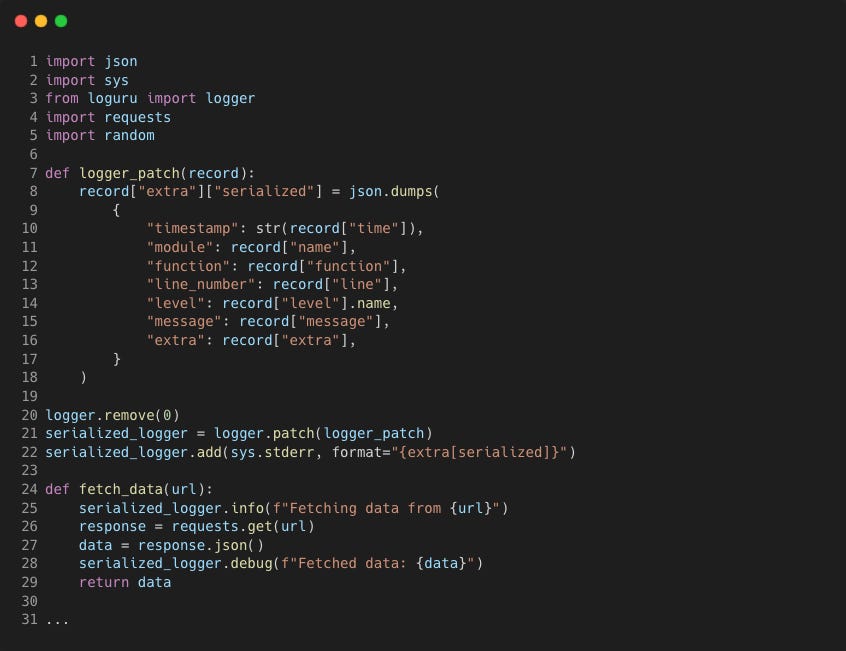
To limit the fields we get back in the logs we can use a custom serialisation function logger_patch
The variables, timestamp, module, function, line_number, level, message and extra are selected in the logger_patch() function to modify the record["extra"] dictionary. The patch() method then applies this to the logger.
Adding contextual information to the extra field helps filtering and correlating logs and can be done by using the Loguru bind or contextualize functions. For example, the following uses the bind method to create a new child logger object that will add the data_feed key and value boring just to those logs.
Custom Logger Class
A data pipeline running in a Lambda function may have several modules and run across multiple scripts. One way to ensure consistent logging is to ensure you only setup your logger once.
If the logger is created at the script level, this means you will need to pass the logger function as a parameter between function calls that sit outside the scope of the script, which is not ideal.
One way to only configure the logger once would be to create a class to hold the logger method as a class method.
Class methods in Python are methods that are bound to the class rather than to instances of the class. They are defined using the @classmethod decorator and take
clsas their first parameter instead ofself. Thisclsparameter refers to the class itself, not the instance.
This follows the Singleton pattern so that only one logger instance is created and reused whenever the class method is called.
Here's what it would look like in a Python class
Now whenever we need a logger object we will only configure and create one instance by directly calling the class method CustomLogger.get_logger()
Any further calls it will return the same logger (at line 26) as the if condition will evaluate to False, skipping the configuration.
Logging with Decorators
Decorators are a powerful tool in Python that allow you to modify the behaviour of functions or methods. We can automatically log the entry, exit, and other relevant details of a function by wrapping it with a decorator.
Loguru already comes with it's own decorator @logger.catch that ensures exceptions are caught by propagating them to the logger.
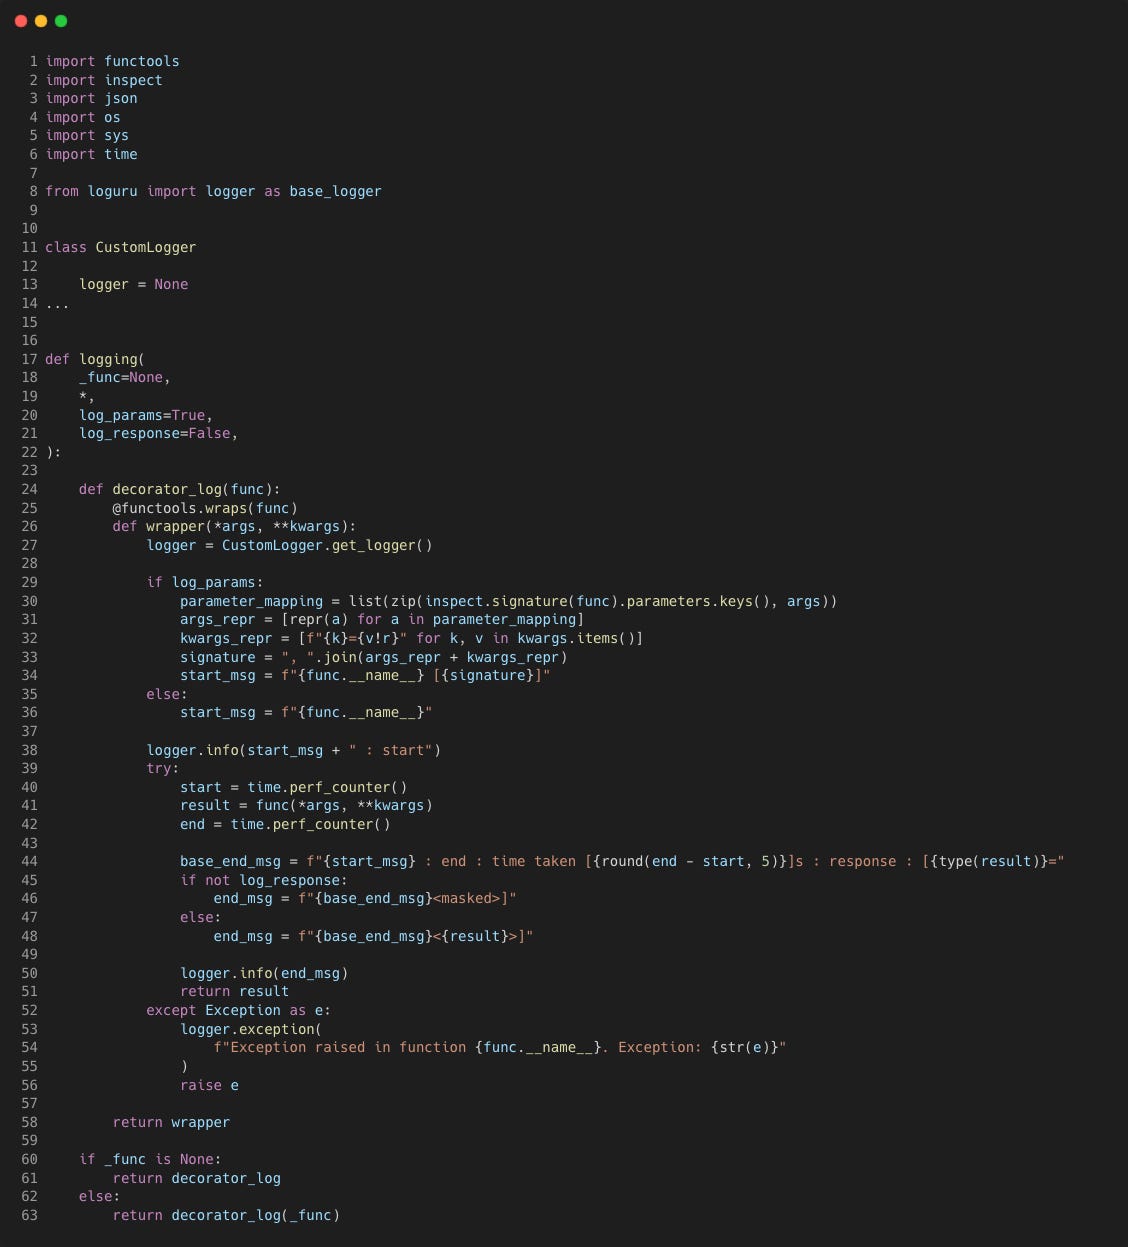
We’ll create a similar custom decorator that does the following:
• Logs standardised messages to track the start and end of a function.
• Logs the time taken to execute the function.
• Optionally logs the parameters passed to the function and its return value.
• Propagates any exceptions that occur during the function’s execution.
Let's breakdown how it works:
logging
The logging function is the main decorator factory. It takes optional arguments to configure logging behaviour
log_params: A boolean indicating whether to log the function’s parameters (default: True).
log_response: A boolean indicating whether to log the function’s return value (default: False).
Depending on whether it’s called with arguments or directly as a decorator, it either returns the decorator_log function or directly applies it.
decorator_log
This is the actual decorator function that wraps the target function. It’s responsible for setting up the logging logic around the function call.
Input: The target function (func) to be decorated.
Output: A wrapped version of the function that includes logging.
wrapper
The wrapper function is where the logging magic happens. It wraps around the target function, adding the following behaviours:
setup
Retrieves a logger instance using CustomLogger.get_logger(). This works well if you are also using the same logger elsewhere within the script, as the same instance will be used.
start
if log_params is True, it gathers the function’s parameters using
inspect.signature. It then formats them into a string representation (signature) to include in the log message.A log message is generated to indicate the start of the function, including the function’s name and, if configured, its parameters.
timing
The decorator records the start time before calling the target function.
After the function executes, it records the end time and calculates the elapsed time.
end
A log message is generated to indicate the end of the function. This includes the time taken to execute and, if log_response is True, the function’s return value. If not, the return value is masked.
exception handling
If the function raises an exception, the decorator logs the exception details using logger.exception.
It then re-raises the exception, ensuring that errors are logged while still allowing them to propagate as they normally would.
Lambda Function Example
Here's an example of how you could use the CustomLogger class and @logging decorator within a Lambda function to simplify your logging and ensure you capture contextual information about the log such as the log stream name and Lambda request ID.
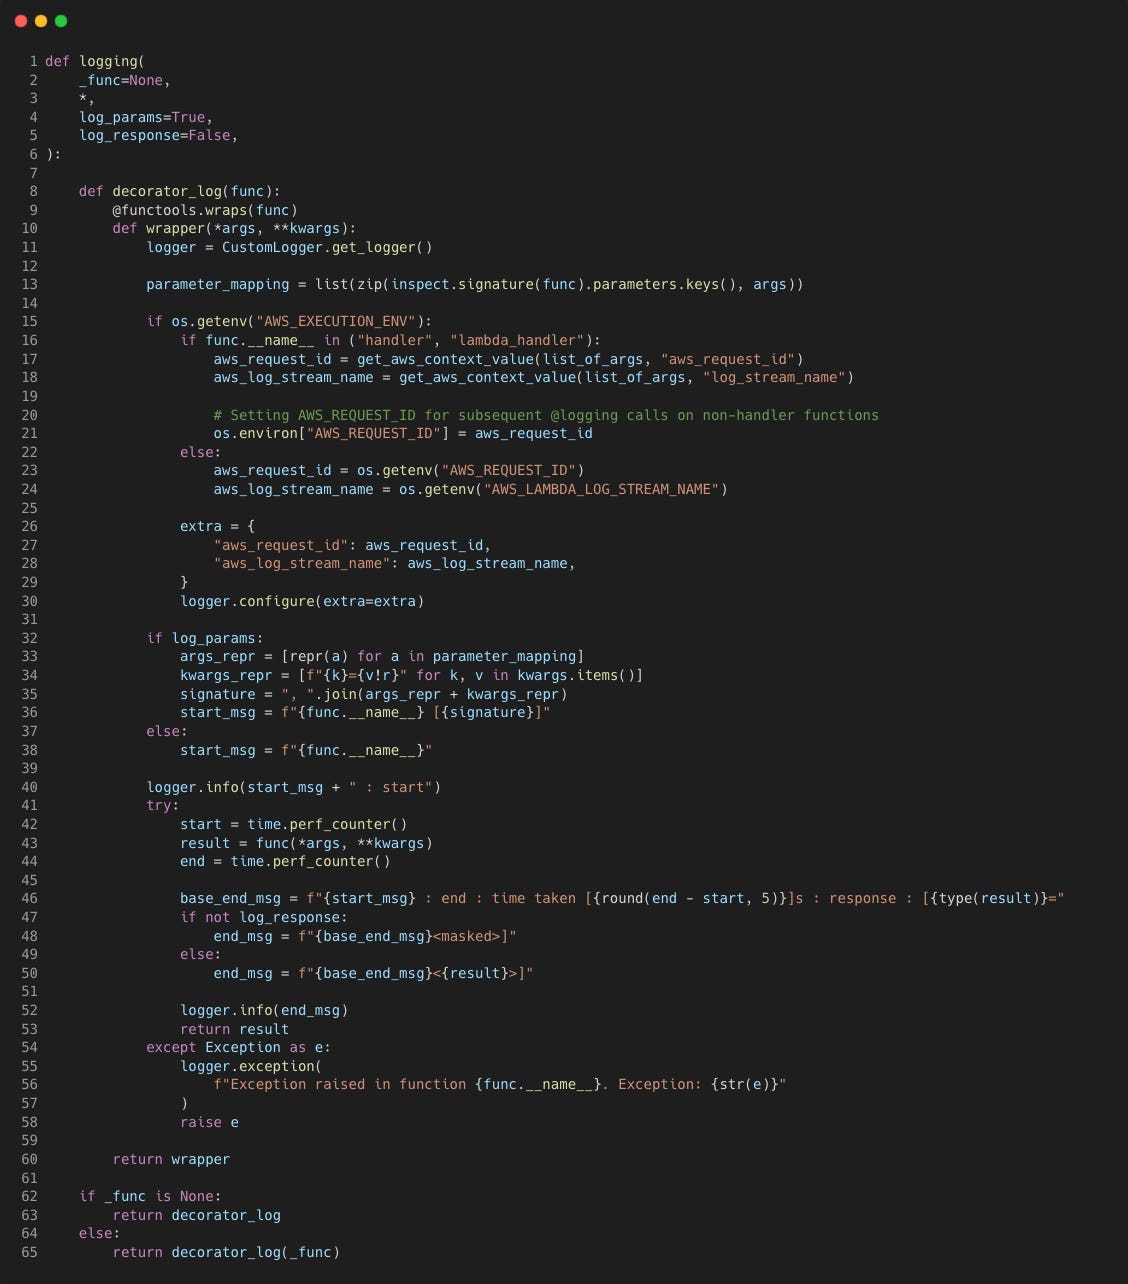
We'll first further customise the @logging decorator so it can check if the environment it is being used in is a Lambda function environment (added lines 15 to 30).
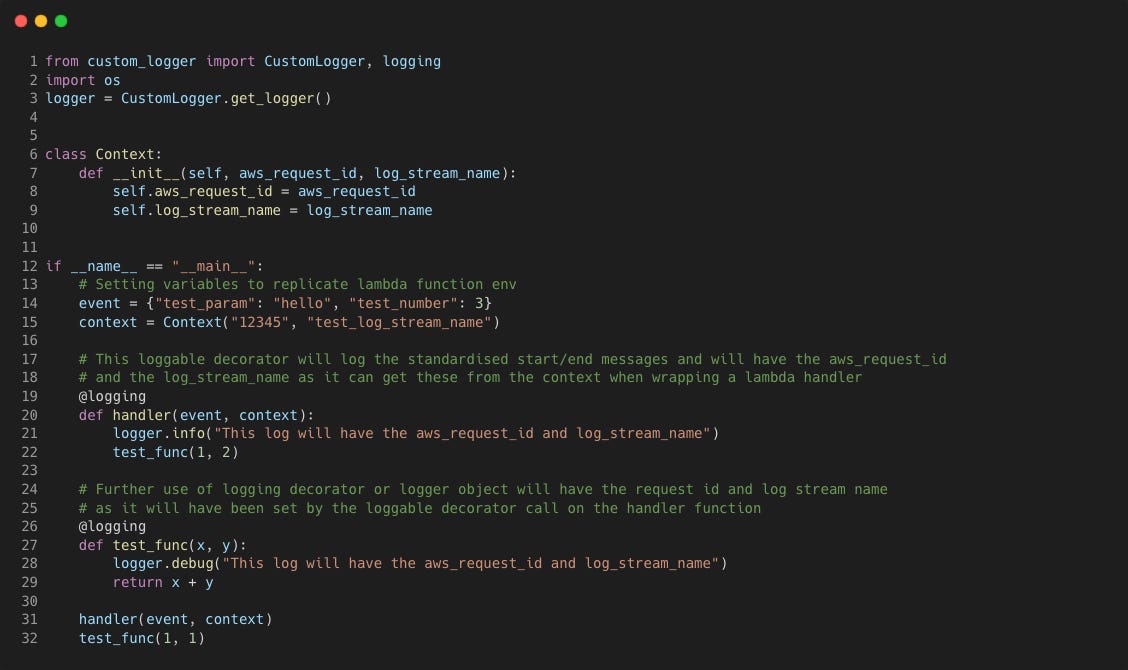
Let's mock up a Lambda function that we can run locally:
Note that the
Contextclass is made to mock the context that would be available when a Lambda function is actually invoked, but the script is ran locally. We also assume that the environment this script runs in has the environment variableAWS_EXECUTION_ENVset to any value.
We’ll now see that the extra field now contains both the log stream name and Lambda request ID in every log, even though we did not bind the information to a child logger.
The changes made to the @logging decorator above means the following now happens:
The
@loggingdecorator will execute before the code within thehandlerfunctionWithin the
@loggingexecution, theif os.getenv(AWS_EXECUTION_ENV)condition on line 15 will beTrue, so theaws_request_idandlog_stream_namewill be retrievable from the Lambda context as it will be part of thelist_of_argspassed to thehandler(theget_aws_context_value functionextracts it).The
aws_request_idwill be stored as an environment variableAWS_REQUEST_IDwhich is required for any further logging to capture this extra contextual information.The Loguru
configuremethod is used to modify the logger object in place to ensure each log call includes the extra contextual information.
As commented in the Lambda script logs, any logging within the handler will benefit from configuration set by the decorator, so the logs will have both the AWS request ID and log stream name.
Now once the test_func(1, 1) function executes after, it will be using the same logger object (as explained with the Singleton pattern) and the logic on line 15 of the @logging decorator will this time retrieve the contextual information from the environment variables instead.
This works well in Lambda functions as the Lambda handler will always be the entry point, meaning we can capture the contextual information and modify the logger object for further downstream logging and in any other modules called.
Finally, we'll run the script again with this time changing the test_func to perform division of numbers rather than addition so we can simulate a DivisionByZero Exception. Here is what the log output looks like.
Closing Thoughts
Having a well defined logging framework that you can use throughout your data pipelines takes away the need to constantly set them up, often with differing configurations.
Using a decorator ensures each function call logs out consistent logs and allows for quicker debugging. You will want to be cautious about when you want to log out the return value or function parameters to prevent data leaking if you are handling sensitive data.
You could get around this by implement masking of certain parameters based on data type or regex expressions within the @logging decorator logic.
Also, if your data pipeline has a function that is being called on a large number of times (e.g. for every row in a large dataframe), this might lead to a lot of logs!
I would love to hear your thoughts on logging with decorators - what's your take?


